
In a previous post I explained how to produce color or intensities histogram of an image. In this post I will post some codes to produce them in different regions. The idea remains the same, however we are going to divide the image in different regions to obtain global and local histograms of the same image.
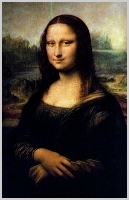
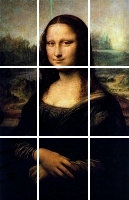
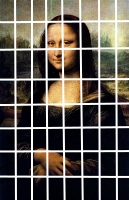
For example Fig 1, Fig 2 and Fig 3 presents the regions for three different type of region divisions: 1, 3, 8 respectively.
The basic goal is to produce small subimages of aproximately the same size and then calculate the histogram over the subimage. Here is the code.
function [data] = regionImHistogram(im, r, bins)

% 1. extract the x and y size of the image
ys = size(im,1);
xs = size(im,2);

% 2. calculate the number of pixels of each region
size = round(ys/r)*round(xs/r)

% 3. create a structure to keep all the histograms
coh = zeros(bins*3, r*r);

% 4. iterate over all the regions
for j = 1:r
    for i = 1:r
        %5. extract the subimage
        % 14/12/2016: this doesn't work - for some reason transform the crop two grayscale
        % clip = im(round((j-1)*ys/r+1):round(j*ys/r),round((i-1)*xs/r+1):round(i*xs/r));

        % 14/12/2016: Use this instead
        clip = imcrop(im,[round((i-1)*xs/r+1) round((j-1)*ys/r+1) round(xs/r)-1  round(ys/r)-1]);

        %6. calculate the histogram and normalize it
        coh(:,(j-1)*r+i) = linearHistogram(clip, bins)/size;
    end
end

% 7. put it all in just one vector
data = zeros(1,numel(coh));
data(:) = coh(:);
Notice that instruction 3 creates a matrix bins*3 x r*r. Remember that the color histograms has a histogram per color so it's three times the number of bins. And we are going to need one per block (3*3). Instruction 5. extract the subimage. Instruction 6. use the function explained in my previous post to build the color/intensity histogram. Instruction 7. is particularly important because I am generating descriptors for training my Adaboost classifier.
Then, this would be the code to produce the histograms of a 3x3 region division
% open the image
im = imread(path/to/image);
% call the function
linear = regionImHistogram(im, 3, 256);
Note that it is almost the same code to produce an intensity histograms of a 3x3 region division
% open the image
im = imread(path/to/image);
% transform to gray scale
im = im = rgb2gray(im);
% call the function
linear = regionImHistogram(im, 3, 256);
There is going to be a final post of how to use the regionImHistogram to generate multiple histograms of different regions and different amount of bins.
Pingback: Lots of features from color histograms on a directory of images
Pingback: Edge orientation histograms in global and local features